You can generate reports* using existing saved results.
*Registered version of Microsoft Excel® is required to generate reports.
- Click the Results tab and select an activity.
- Click the
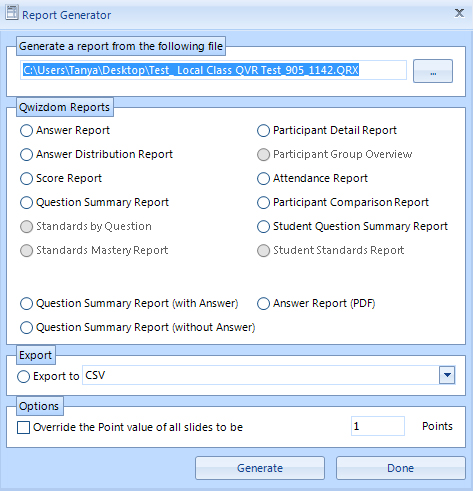
 Reports Wizard button. The Reporting Wizard window opens.
 - Select a report type and click Generate.
- View, print, or save as a PDF or Excel document.
Report Features
- Answer Report – displays participant information, bar chart, question responses, correct answer and score
- Answer Distribution Report – displays total percentage of responses for each question with correct answer and bar chart
- Score Report – displays participant information with various point totals and scores
- Question Summary Report – displays bar chart next to each question
- Standards by Question – displays the standards that are linked to the questions
- Standards Mastery Report – displays percentage of performance in meeting each standard in the activity
- Participant Detail Report – displays participant information
- Participant Group List Report – displays participant group information
- Attendance Report – displays participant information with their remote login time, number of questions answered and total questions
- Participant Comparison Report – displays an individual participant’s results of an activity
- Participant Question Summary Report – displays an individual participant’s results with bar chart next to each question
- Student Standards Report – displays how the individual participant met each standard in the activity
- Answer Report (PDF) – displays each question slide with the user’s response and the correct answer
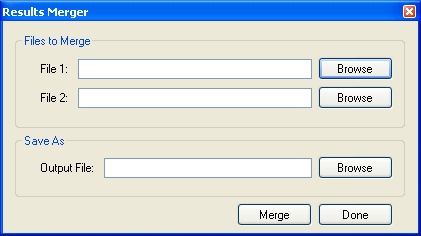
Export:
- Convert to .CSV – convert .QRX file to .CSV.
- Gradespeed – saves .QRX file to .CSV displaying only Participant ID and points
- Moodle
- Blackboard
Options:
- Override the Point value of all slides to be — points-overrides point value that was awarded during presentation.
Update or Edit Results
- Click the Results tab and select an activity.
- Click on the
 Quick Mark icon.
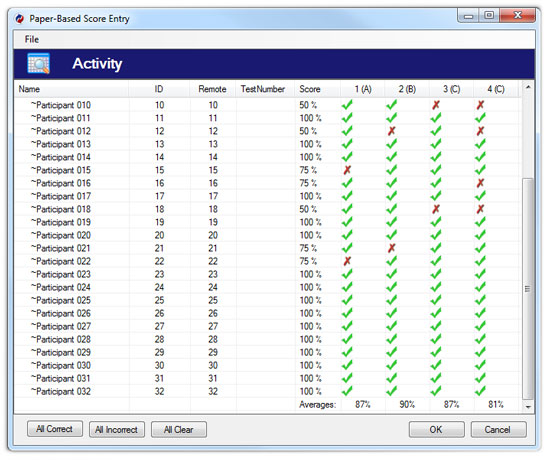
- Click in a cell or select a column to change answers.
- Click OK when finished.