Qwizdom Toolbar
There are many ways to customize your Qwizdom presentations. Right-click on the Qwizdom Toolbar to view options menu.

- Buzz-In Box/Participant Counter
The Buzz-In Box displays the percentage of participants who have answered.

During a presentation: Right-click the Qwizdom Toolbar and go View/Buzz – in Box to display the percentage. - Timer
Timer displays the remaining time in which participants can submit responses. Add additional time by clicking on the + Add icon.

You can add or remove the timer during a presentation.
– Right-click the Qwizdom Toolbar and select Settings.
– Under the Display tab, use the Timer drop-down menu to change the timer settings.
– Click OK to close and apply changes. - Answer Grid
The Answer Grid indicates participant response by corresponding remote ID numbers.
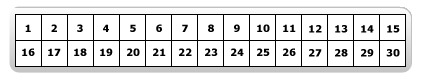
To Show/Hide the Answer Grid.
– Right-click the Qwizdom Toolbar and go View/Answer Grid.
– Right-click Answer Grid to change display settings, including size, number of columns, placement, etc.

Presentation Tools
Use ![]() Re-Pose,
Re-Pose, ![]() Response Graph,
Response Graph,![]() Pick, and
Pick, and ![]() Game icons when presenting activities using a desktop or laptop.
Game icons when presenting activities using a desktop or laptop.
- Reposing a Question
Reposing is used to ask a question again and/or when you accidentally skip a slide that needs to be answered. Reposing the question overwrites the previous responses if any were recorded.
– Click the Repose button to pose the question slide again.
– Click the Repose button again to stop. - Response Graph
– Click the Response Graph button.
– The Response Graph appears.
– Click the Response Graph again to remove the graph. - Picking Participants
– Click the Pick button to randomly call upon a participant.
– The participant’s name or participant ID appears on screen.
– Click the Pick button again to remove the name.
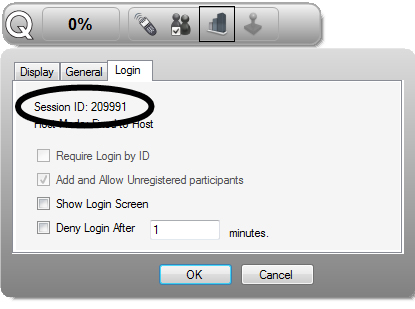
Display Session ID During a Presentation
1. Right-click the Qwizdom Toolbar and select the Login tab. The Session ID will appear at the top of the window.
Automatically Show Correct Answer on Response Chart
Displays a fraction and percentage of correct answers. For example: Correct Answer(s)10/12 83%. To activate this feature during a session, right-click the Qwizdom Toolbar and select Settings. Under the Display tab, select Automatically Show Correct Answer on Chart and then click OK.
Right/Wrong Feedback
This feature allows participants to see if their response is right or wrong. Feedback appears on the LCD screen of the participant’s remote during presentation. A check mark will indicate a correct response, an X will indicate an incorrect response. If the feedback is disabled, a check mark and X appears on the LCD screen indicating that a response was received.
You can turn this feature on and off during a presentation by
- Right-clicking the Qwizdom Toolbar and selecting Settings.
- Under the General tab, click Send right/wrong feedback.