Presentation Features

Qwizdom Toolbar

There are many ways to customize your Qwizdom presentations. Right-click on the Qwizdom Toolbar to view options menu.
Q-Toolbar-2014

  • Buzz-In Box/Participant Counter
    The Buzz-In Box displays the percentage of participants who have answered.
    CTrackPercent
    During a presentation: Right-click the Qwizdom Toolbar and go View/Buzz – in Box to display the percentage.
  • Timer
    Timer displays the remaining time in which participants can submit responses. Add additional time by clicking on the + Add icon.
    timer
    You can add or remove the timer during a presentation.
    – Right-click the Qwizdom Toolbar and select Settings.
    – Under the Display tab, use the Timer drop-down menu to change the timer settings.
    – Click OK to close and apply changes.
  • Answer Grid
    The Answer Grid indicates participant response by corresponding remote ID numbers.
    AnswerGrid
    To Show/Hide the Answer Grid.
    – Right-click the Qwizdom Toolbar and go View/Answer Grid.
    – Right-click Answer Grid to change display settings, including size, number of columns, placement, etc.

Presentation Tools

Use repose Re-Pose, response graph Response Graph,pick Pick, and animationGame icons when presenting activities using a desktop or laptop.

  • Reposing a Question
    Reposing is used to ask a question again and/or when you accidentally skip a slide that needs to be answered. Reposing the question overwrites the previous responses if any were recorded.
    – Click therepose Repose button to pose the question slide again.
    – Click therepose  Repose button again to stop.
  • Response Graph
    – Click the response graph Response Graph button.
    – The Response Graph appears.
    – Click the response graph Response Graph again to remove the graph.
  • Picking Participants
    – Click the pick Pick button to randomly call upon a participant.
    – The participant’s name or participant ID appears on screen.
    – Click the pick Pick button again to remove the name.


Display Session ID During a Presentation

1. Right-click the Qwizdom Toolbar and select the Login tab. The Session ID will appear at the top of the window.

SessionID-DuringPres


Automatically Show Correct Answer on Response Chart

Displays a fraction and percentage of correct answers. For example: Correct Answer(s)10/12 83%. To activate this feature during a session, right-click the Qwizdom Toolbar and select Settings. Under the Display tab, select Automatically Show Correct Answer on Chart and then click OK.

Right/Wrong Feedback

This feature allows participants to see if their response is right or wrong. Feedback appears on the LCD screen of the participant’s remote during presentation. A check mark will indicate a correct response, an X will indicate an incorrect response. If the feedback is disabled, a check mark and X appears on the LCD screen indicating that a response was received.

You can turn this feature on and off during a presentation by

  1. Right-clicking the Qwizdom Toolbar and selecting Settings.
  2. Under the General tab, click Send right/wrong feedback.

0 people did not find this helpful

Back To Top

Remote Login

Logging in with IDs allows participants to use any remote. The participant is identified by a unique ID number that is set in participant lists.

  • Participant IDs can only be numeric.
  • IDs cannot be used for more than one participant (IDs cannot be duplicated).
  • Maximum number of digits allowed for IDs is:
    – 8 for Q2RF remotes.
    – 9 for Q4RF remotes.
    – 8 for Q5RF remotes.
    – 14 for Q6RF remotes.
    – 15 for QVOTE remotes.
  1. Click the CPresent Present button. The Presentation Setup window will appear.
  2. Select a participant list.
  3. Click the Login tab.
  4. Check the Require Login by ID option.
  5. Checking the Show Login Screen, if desired.
  6. Check the Add and Allow Unregistered Users to allow participants not on the list to join the session.
  7. Select all other preferred options and click OK to present. The presentation will begin.
  8. The Q2RF remotes will display –U. All other remotes will prompt for UserID.
  9. Participants will enter their ID and press the Send key.
    Please Note: If Add and Allow Unregistered Users is checked, participants not on the class list may be prompted to enter their User ID twice to confirm.
  10. Once everyone has logged in, begin the presentation.
  11. You can start the presentation as participants log in. Participants who are late can log in later, if you have not set a timer to deny log in.

Login Timer
You can deny login after a certain amount of time by setting the time under the Login tab.

  1. Check the Deny Login After — Minutes option.
  2. Enter the number of minutes that participants have to log in. For example, you have selected to deny log in after 5 minutes. After 5 minutes have passed, participants who try to log in will be denied.


Troubleshooting

If the Q4RF remote displays Denied, or the Q5RF remote displays Access Denied, or the QVOTE or Q6RF displays Session ID Login Denied, or the Q2RF remote displays –U, then the Participant ID may have been entered incorrectly.

  • For Q2RF remotes, press the Hand key, re-enter the Participant ID, and press the Join key.
  • For Q4RF remotes, press the Menu key, use the right arrow to scroll to User ID, and press the Send (double arrows) key to select it. Re-enter the
  • Participant ID and press the Send (double arrows) key.
  • For Q5RF remotes, press the C (clear) key, re-enter the Participant ID, and press the Send (double arrows) key.
  • For QVOTE or Q6RF, click the On/Off key select Enter User ID. Scroll to Enter Session ID, press the  menu select key, re-enter the User ID, and press the Join key.
  • The Participant IDs will be remembered for the session until another participant list is selected.

0 people did not find this helpful

Back To Top

Using Remotes in Presentation

Q6iRF Instructor Remote Tips

  • The Q6iRF Instructor Remote will display a list of actions when ready.
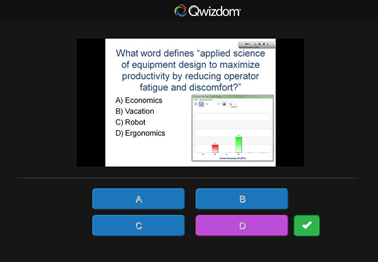
  • Press the (3) key to display the public response graph. Press again to close.
  • Press the (2) key to display the graph on the instructor’s LCD. Press again to close.
  • Press the (1) key to randomly call upon a participant during presentation. Press again to close.
  • Press the (6) key to pose a spontaneous question. A list of question types will appear on the LCD. Use the up/down arrows to navigate through the question types. Press the  Select key to choose the question type. Enter the correct answer and press Send; if the answer is survey only, press the Send key without selecting an answer.
  • Press the (5) key to display the list of participants who have requested help.
  • Press the  Select key to play PowerPoint animations during a presentation.*


Q5RF Instructor Remote Tips

  • The Q5RF Instructor Remote will display Ready or Last Key when it is connected to the host.
  • Since the Q5RF Instructor Remote is not applicable during answer keys, the LCD screen will display Access Denied.
  • Press the (/) key on the Q5RF Instructor Remote to display the response graph. Press again to close.
  • Press the (0) key on the Q5RF Instructor Remote to display the graph on the instructor’s LCD. Press again to close.
  • Press the Pick (.) key on the Q5RF Instructor Remote to randomly call upon a participant during presentation. Press again to close.
  • Press the 1 (A) key on the Q5RF Instructor Remote to bring up a window shade. Press again to close.
  • Press the Show (7) key to show current scores and start game animations during game mode. In Fast Track and Mission to Mars, press the (1) key to move to the next question and press the (3) key to display track.
  • Press the New Q (-) key to pose a spontaneous question. A list of question types appear on the LCD. Use the up/down arrows on the thumb pad to navigate through the question types. Press the Send key to select the question type. Select the correct answer and press Send; if the answer is survey only, press the Send key without selecting an answer.
  • Press the (?) key to display the list of participants who have requested help.
  • Press the circle key, in the thumb pad, to close out of the presentation (must be on last slide), play the PowerPoint® animations and schemes (if any were applied), and move to the next slide.

* Features only work in Actionpoint Software.


Q7 Presenter Tips

  • The Q7RF Presenter Tablet will display Ready when it has successfully connected to the host.
  • Press DisplayResults24to display the public response graph. Press again to close.
  • Press PrivateResults24to display the graph on the instructor’s LCD. Press again to close.
  • Press pick2_24 to randomly call upon a participant during presentation. Press again to close.
  • Press Question Type24 to pose a spontaneous question. A list of question types will appear on the LCD. Use the toggle to navigate through the question types. Press the Send key to select the question type. Select the correct answer and press Send; if the answer is survey only, press the Send key without selecting an answer.
  • Press HelpNew24 to display the list of participants who have requested help.
  • Press show2_24 Show to display game animations.


Participant Remote Tips

  • Remote displays will vary when they are ready to start an activity/presentation.
    Qwizdom will be displayed on the Q4RF and Q5RF remotes when a lesson (non-question) slide is in view. Ready will be displayed on the QVOTE and Q6RF when remotes have found the host and are ready for a question slide.
  • Remote displays will vary during an activity/presentation.
    For Q2RF remotes, participants will see a blank screen with a battery icon. For QVOTE, Q4RF and Q5RF remotes, participants will either see answer choices or a blank screen (depending on question type) on their remote during a question slide. For Q6RF remotes, question text and/or answer choices will appear on the LCD screen (display varies depending on question type). See Creating Slides for information on setting up the different question types.
  • Request Help.
    For Q2RF remotes, press the Help (Hand) key. To request help on the Q4RF and Q5RF, press the Menu key to select Help and press Send. For the QVOTE and Q6RF, press the Menu button and press the menu select key.
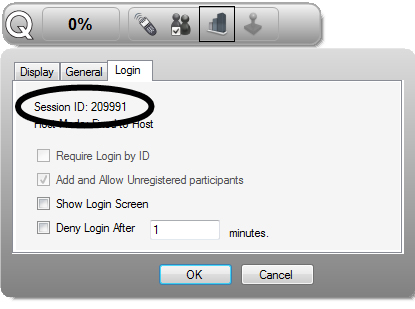
 

Change Session ID

  • Q2RF remote: When the remote is on, wait for the remote to time out and turn off. When you turn it back on, press the Help key. When you see –S on the display, enter the Session ID and press the Send key.
  • Q4RF remote: Press the Menu key and use the right arrow to scroll through the menu options. When you see Sess. ID, press the Send key to select it. An existing Session ID may appear and the remote will ask if you want to change it. Press T for yes and enter the new Session ID. Press the Send key to confirm.
  • Q5RF remote: Press the Menu key when the remote displays No Host Found. Use the thumb pad to navigate through the menu options and press the Send key to select Enter Session ID.
  • QVOTE and Q6RF remote: Press the Menu key, scroll to Enter Session ID, press the MenuSelectKey menu select key, re-enter the Session ID, and press Join to submit.

Troubleshooting Tips

The Q4 LCD screen on the participant remotes may read Push Key, Inactive, Not Active, press the Send (double arrows) key to “wake up” the remote. If the remote still displays Not Active, re-enter the Session ID. Go to Changing Session IDs for more information.

The QVOTE and Q6 LCD screen on the participant remotes may display Power Save Mode. This indicates that the remote is idle. Click RESUME, to reactivate.

If the Q4RF displays No Net, or the Q5RF remote displays Host not found, or the QVOTE or Q6RF displays Session ID Not Found, or the Q2RF remote displays – – – and turns off, re-enter the Session ID. Go to Changing Session IDs for more information.

If the Q4RF remote displays Denied, or the Q5RF remote displays Access Denied, or the QVOTE or Q6RF displays Session ID Login Denied, or the Q2RF remote displays –U, the Participant ID is incorrect, or the Remote ID attempting to participate isn’t in the participant list that was loaded. Re-enter the Participant ID, and check to make sure that Remote ID is in the participant list.


How to respond for each question type during a presentation using Q2RF participant remotes:

  • True/False – press T or F key.
  • Yes/No – press Yes or No key.
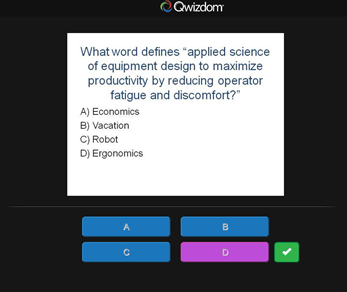
  • Multiple Choice – press A, B, C, D, E, or F key.
  • Single Digit Numeric – enter a single number key.
  • Rating Scale (1-5) or (1-7) – enter a single number.


How to respond for each question type during a presentation using Q4RF and Q5RF participant remotes:

  • True/False – press T or F key and then press the Send key.
  • Yes/No – press Y or N key and than press the Send key.
  • Multiple Choice – press A, B, C, D, E, or F and then press the Send key.
  • Multiple Mark – select multiple letter choices and than press the Send key.
  • Numeric – enter the numbers and than press the Send key.
  • Sequence – enter the numbers in the correct order and press the Send key.
  • Short Text Response – for Q5 remotes only. The alphabet menu will automatically appear when this question type is displayed. Use the arrows on the thumb pad to navigate through the letters, using the Circle key to select the letter(s). Press the Send key to confirm your answer.


How to respond for each question type during a presentation using QVOTE and Q6RF participant remotes:

  • True/False – use down arrow to scroll to T or F and then press the Send key.
  • Yes/No – use down arrow to scroll to Y or N and then press the Send key.
  • Multiple Choice – use down arrow to scroll to A, B, C, D, E, or F and then press the Send key.
  • Multiple Mark – use down arrow to scroll to answer choice, click the MenuSelectKey Menu Select key to select multiple answer choices, and then press the Send key.
  • Numeric – enter the numeric answer and then press the Send key.
  • Sequence – enter the numbers in the correct order and then press the Send key.

Q6RF Only:

  • Short Text Response – enter in the appropriate answer and then press the Send key.
  • Text Response – enter in the sentence/s answer and then press the Send key.
  • Text Edit – use directional arrows to scroll to the text that needs editing, press Delete to remove incorrect character/s, enter correction, and press the Send key when finished.
  • Equation – enter the numeric answer (add special characters by pressing the Sym button) and then press the Send key.

0 people did not find this helpful

Back To Top

Presenting QVR Response App

You will need to purchase a QVR Presenter license to use this feature. Email info@qwizdom.com for pricing details.

To begin a QVR presentation follow the steps below:

  1. Select an activity, then click CPresent Present to begin setting up a presentation.
  2. In the Presentation Setup window, select the presentation options (i.e. Participant List, Save Results, and Present As). See Presentation Setup for details.
  3. Click on Device Settings tab. Check Enable Internet-Based Communication. Click OK to present.
  4. Login with your credentials. (If you have not registered, click on the ‘New User’ link at the bottom of the window.)
  5. The Session ID will appear on the Qwizdom Toolbar. Click on the link to make the QVR Session ID number large. It’s helpful to create an instructional slide to help users login in.
    QVR-Login-Slide
  6. Instruct participants to login to the QVR session at qvr.qwizdom.com using a browser of their choice; or download the Qwizdom QVR app from the Google Play or Apple App store.
  7. In the QVR window, instruct participants to login with the 6 digit QVR Session ID number and then press Launch.
    QVR-Login
  8. Participants may be asked to enter a User ID if you selected a class list in the Presentation Setup window.
  9. Participants will see the presentation via their personal web-enabled device. If the show right/wrong feedback feature is turned on in the Presentation Settings window a green check mark will appear if the participant answered correctly. If an answer is incorrect, a red X will appear.Qwizdom Response App Polling Slide
  10. The instructor can display a chart showing the results of all other users currently in the presentation.Qwizdom Response App Results
  11.  At the end of the presentation, this window will appear:
    Qwizdom Response App

0 people did not find this helpful

Back To Top

Presenting with Collaboration

Qwizdom software includes 5 Qwizdom Notes+ licenses that allow for classroom collaboration. (Additional licenses are available for a fee–email info@qwidom.com for pricing.)

Participants can view live lessons, respond, share annotations, take notes, and save presentations for review, using any tablet or laptop on the same local network as the presenter.

Start Presentation

  1. Select an activity and click Start Presentation. CPresent
  2. Select the Device Settings tab in Presentation Setup.
    collab1
  3. Check box to Enable local network communication.
    (Local communication allows users to connect to the session by IP address. All users must be on the same network as the presenter.)
  4. Click OK to start the presentation.

Participants Join Presentation

  1. On tablets, participants open the Qwizdom Notes+ App (available from the Google Play, Apple App, and Windows App stores).
    JoinSess
  2. Tap File and choose Join Session.
  3. Enter the local IP address of the presenter’s computer–displayed on the feedback response indicator (Q Bar) on the presentation screen (for example 192.168.1.120). [Do not enter the port number (the 4 digits following the colon). For example if 192.168.1.120:8080 is displayed, do not type ‘8080’.]
  4. Tap OK.

Alternatively, if participants do not have the Qwizdom Notes+ App, but have internet-enabled computers, they can type the local IP address of the presenter’s computer into a web browser, on port 8080. For example 192.168.1.120:8080. (In this case, the port number ‘8080’ is needed in order to join the session.)
(Note: browser version does not contain the same feature set as the app, such as saving and adding notes.)

Enable Collaboration
collab2

  1. Presenter taps/clicks the Collaboration icon on the feedback response indicator (Q Bar).
  2. Window appears in which individual participants can be selected or de-selected.
    If participant (class) list is being used, names will be shown. Otherwise, device IDs display.
    collab3
  3. Check box to enable collaboration.
  4. Participants selected by the presenter for collaboration then see a Share icon at the top of their Qwizdom Notes+ screen.
  5. Collaboration participant annotates or adds text or other objects to the screen, then taps the share icon. Share
  6. Shared additions are visible to presenter, and all other participants.

Participants Save Presentation

Once the presenter has stopped the presentation, the slides will appear on the right-hand side of the participant’s screen. At this point, the presentation–including all annotations and added objects–can be saved on the participant’s device for future review.

Please note: this feature is only available with the Qwizdom Notes+ App. It is not an option if connected to the session via web browser.

  1. Tap File.
  2. Tap Save.
  3. Type in a file name and tap OK.

0 people did not find this helpful

Back To Top

Response Graph

During presentation, you can display a response graph to see the results of the question. There are two response graphs you can display: the public response graph and the private graph.

Private Response Graph using the Q6iRF Instructor Remote

  1. Press the (2) key on the Q6iRF instructor remote.
  2. The response graph will display on the LCD screen. Click Details to view each participant’s response, response time and which students did not respond.
  3. Press the (2) key again to close the response graph.

Public Response Graph using the Q6iRF Instructor Remote

  1. Press the (3) on the Q6iRF Instructor Remote.
  2. The response graph will appear on screen for the participants to view.
  3. Press the right/left arrows to view a different graph of the results.
  4. Press the (3) key again to remove the response graph.
    Please Note: If you have a graph displayed, either on the Q6iRF Instructor Remote or computer, you must first remove that graph before displaying the private response graph and/or move onto the next question.

Public Response Graph using the Q7RF Tablet

  1. Press the DisplayResults Public Graph icon on the Q7RF Tablet.
  2. The response graph appears on the computer screen.
  3. Press the DisplayResults Public Graph icon on the Q7RF Tablet again to close the response graph.
    Please Note: If you have a graph displayed, either on the Q7RF Tablet or computer, you must first remove that graph before displaying the private response graph and/or move onto the next question.

Private Response Graph using the Q7RF Tablet

  1. Press the PrivateResults24 Private Graph icon on the Q7RF Tablet.
  2. The response graph will display on the Q7RF Tablet’s LCD.
  3. Press the PrivateResults24 Private Graph icon on the Q7RF Tablet again to close the response graph.

Public Response Graph using the Q5RF Instructor Remote

  1. Press the (/) key on the Q5RF Instructor Remote.
  2. The response graph appears on screen for the participants to view.
  3.  Press the right/left arrows to view a different graph of the results.
  4. Press the (/) key again to remove the response graph.
    Please Note: If you have a graph displayed, either on the Q5RF Instructor Remote or computer, you must first remove that graph before displaying the private response graph and/or move onto the next question.

Private Response Graph using the Q5RF Instructor Remote

  1. Press the (0) key on the Q5RF Instructor Remote.
  2. A bar chart showing the number of responses will display on the Q5RF Instructor Remote’s LCD screen.
  3. Press the (0) key again to remove the graph.

0 people did not find this helpful

Back To Top

Games

  • Using computer mouse – click on the animation Game icon on the Qwizdom Toolbar.
  • Q7 Tablet – press the show2_24 Show icon.
  • Q6i Instructor Remote – press the right arrow key.*
  • Q5RF Instructor – press the number (7) Show key.

* Features only work in Qwizdom Connect Software.

Monster Truck Race
Monster Truck is a race car game in which points are rewarded based on the response time of each remote.

  1. Click the CPresentPresent button.
  2. The Presentation Setup window appears.
  3. Select a Participant List.
  4. Select how you would like to save the results.
  5. Click the Presentation drop-down arrow and select Monster Truck Race.
  6. Select the options you would like available during presentation.
  7. Click OK to start the presentation.
  8. A question slide appears.
  9. Participants will send in their responses.
  10. Points are awarded by correct responses sent in the least amount of time.
  11. The winner will be displayed when all questions have been answered or when the game has ended.

Space Voyager
Space Voyager is a space ship game in which points are rewarded based on the response time of each remote.

  1. Click theCPresent Present button.
  2. The Presentation Setup window appears.
  3. Select a Participant List.
  4. Select how you would like to save the results.
  5. Click the Presentation drop-down arrow and select Space Voyager.
  6. Select the options you would like available during presentation.
  7. Click OK to start the presentation.
  8. A question slide appears.
  9. Participants will send in their responses.
  10. Points are awarded by correct responses sent in the least amount of time.
  11. The winner will be displayed when all questions have been answered or when the game has ended.

0 people did not find this helpful

Back To Top

Saving Results

All results are saved as a .QRX file but can be converted into a .CSV file.

Manual Save

  1. Click the CPresent Present button. The Presentation Setup window opens.
  2. Select Save As.
  3.  Select a location and name the results file.
  4. Click Save.

Auto-save

  1. Click the CPresent Present button. The Presentation Setup window opens.
  2. Select Auto Save and select a location. The file name will contain the document title, participant list, date, and time.

Auto-Save to Results Manager

  1. Click the CPresent Present button. The Presentation Setup window opens.
  2. Select Auto Save to Results Manager.

The results will save in the Results tab when the presentation is complete.

Save Results as a PDF or CSV.
You can save most reports out as a pdf or csv file.

  1.  Click on the Results tab and select a results file.
  2. Click on the Reports2014 Report Generator icon on the toolbar and browse to the results file.
  3. Click on the Save-DropDownSave icon and select Excel or Adobe Acrobat.

0 people did not find this helpful

Back To Top

Results

You can generate reports* using existing saved results.
*Registered version of Microsoft Excel® is required to generate reports.
ReportsWizard-2014

  1. Click the Reports2014 Report Generator icon.  The Reporting Wizard window will appear.
  2. Click Browse to search for the file.
  3. Click Open
  4. Select a report type and click Generate.
  5. View, print, or save as a PDF or Excel document.

Report Features

  • Answer Report – displays participant information, bar chart, question responses, correct answer and score
  • Answer Distribution Report – displays total percentage of responses for each question with correct answer and bar chart
  • Score Report – displays participant information with various point totals and scores
  • Question Summary Report – displays bar chart next to each question
  • Standards by Question – displays the standards that are linked to the questions
  • Standards Mastery Report – displays percentage of performance in meeting each standard in the activity
  • Participant Detail Report – displays participant information
  • Participant Group List Report – displays participant group information
  • Attendance Report – displays participant information with their remote login time, number of questions answered and total questions
  • Participant Comparison Report – displays an individual participant’s results of an activity
  • Participant Question Summary Report – displays an individual participant’s results with bar chart next to each question
  • Student Standards Report – displays how the individual participant met each standard in the activity
  • Answer Report (PDF) – displays each question slide with the user’s response and the correct answer

Export:

  • Convert to .CSV – convert .QRX file to .CSV.
  • Gradespeed – saves .QRX file to .CSV displaying only Participant ID and points
  • Moodle
  • Blackboard

Options:

  • Override the Point value of all slides to be — points-overrides point value that was awarded during presentation.

0 people did not find this helpful

Back To Top

Merging Results

Two separate result files generated from the same activity and participant list can be merged to create one results file.

  1. Click QwizdomTools Qwizdom Tools, located in the bottom right-hand corner of the screen.
  2. Select Utilities.
  3. Select Results Merger. The Results Merger window appears.
    APResultsMerger
  4. In the Files to Merge area, click Browse for File 1.
  5. Select the .QRX results for File 1.
  6. Then click Browse for File 2.
  7. Select the .QRX results for File 2 you want to merge with File 1.
  8. In the Save As area, click Browse. The Save As window appears.
  9. Select a location for the results to save and enter a name.
  10. Click Merge.The two files will merge into one and save in the location that was selected with the new name. When it is done, a prompt will appear stating the merge is complete.
  11. Click Done to exit the Merge Results window.

0 people did not find this helpful

Back To Top